
Choose the comparison day
Choosing a date rebases each series to 100 so growth can be compared from the same starting point.
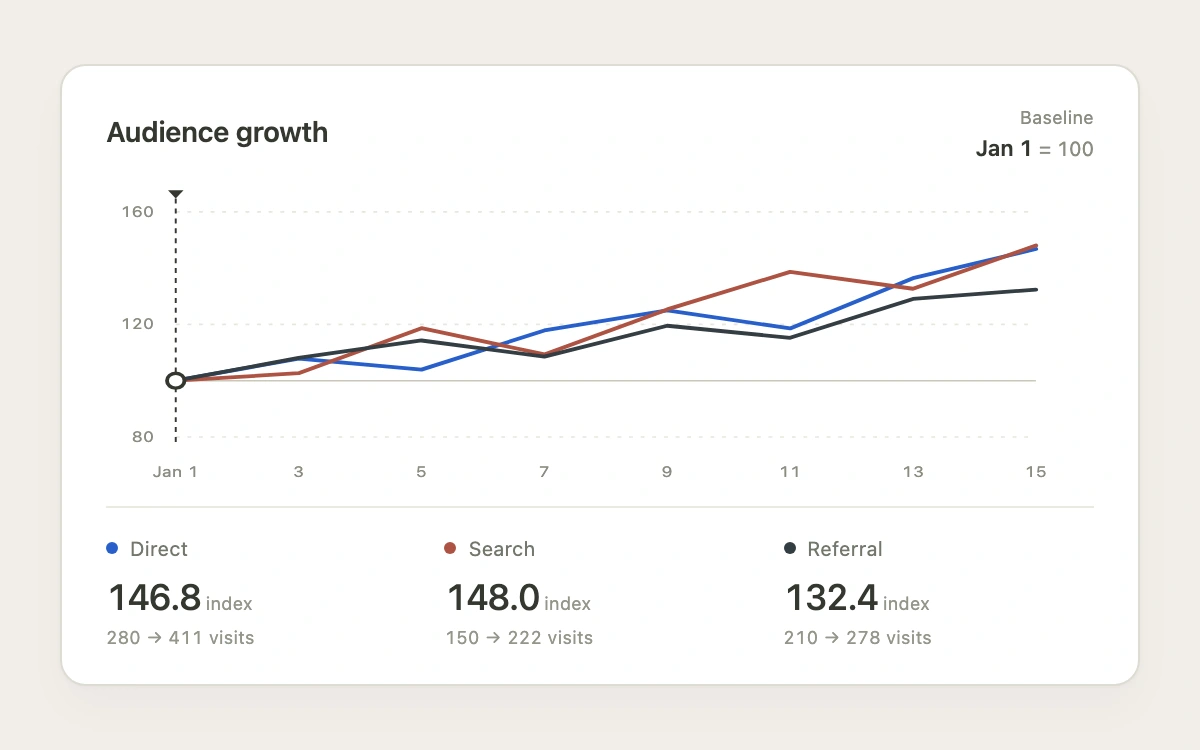
Select a date in the chart, or use arrow keys, Home and End to move the baseline.
Subframe Original · MIT
Add to your project
Component source
Standalone React component. Styles are included.
React only. No additional packages.
Render the default export inside a container with a defined height. Its optional active prop stops movement when false. This example works with React 19; Next.js projects can use it as a client component.
View source code
/**
 * MIT License
 * Copyright (c) 2026 Subframe
 *
 * Permission is hereby granted, free of charge, to any person obtaining a copy
 * of this software and associated documentation files (the "Software"), to deal
 * in the Software without restriction, including without limitation the rights
 * to use, copy, modify, merge, publish, distribute, sublicense, and/or sell
 * copies of the Software, and to permit persons to whom the Software is
 * furnished to do so, subject to the following conditions:
 *
 * The above copyright notice and this permission notice shall be included in all
 * copies or substantial portions of the Software.
 *
 * THE SOFTWARE IS PROVIDED "AS IS", WITHOUT WARRANTY OF ANY KIND, EXPRESS OR
 * IMPLIED, INCLUDING BUT NOT LIMITED TO THE WARRANTIES OF MERCHANTABILITY,
 * FITNESS FOR A PARTICULAR PURPOSE AND NONINFRINGEMENT. IN NO EVENT SHALL THE
 * AUTHORS OR COPYRIGHT HOLDERS BE LIABLE FOR ANY CLAIM, DAMAGES OR OTHER
 * LIABILITY, WHETHER IN AN ACTION OF CONTRACT, TORT OR OTHERWISE, ARISING FROM,
 * OUT OF OR IN CONNECTION WITH THE SOFTWARE OR THE USE OR OTHER DEALINGS IN THE
 * SOFTWARE.
 */
"use client"
import * as React from "react"

export type Config = { seriesCount: number; pointCount: number; showRawValues: boolean; pegSettleMs: number }
export const DEFAULT_CONFIG: Config = { seriesCount: 3, pointCount: 8, showRawValues: true, pegSettleMs: 160 }
const SERIES = [
  { name: "Direct", color: "#295fca", values: [280, 302, 291, 330, 350, 332, 382, 411, 394, 430, 442, 469] },
  { name: "Search", color: "#ad5343", values: [150, 154, 178, 164, 188, 208, 199, 222, 241, 255, 267, 288] },
  { name: "Referral", color: "#343d43", values: [210, 227, 240, 228, 251, 242, 271, 278, 293, 286, 321, 328] },
  { name: "Social", color: "#b4964b", values: [100, 108, 103, 119, 115, 133, 129, 142, 151, 143, 165, 174] },
]
const bound = (value: number, min: number, max: number) =>
  Math.min(max, Math.max(min, Number.isFinite(value) ? value : min))
function Chart({ active, settings }: { active: boolean; settings: Config }) {
  const [baseline, setBaseline] = React.useState(0)
  const [keyboard, setKeyboard] = React.useState(false)
  const buttons = React.useRef<(HTMLButtonElement | null)[]>([])
  const series = SERIES.slice(0, settings.seriesCount)
  const values = series.map((item) =>
    item.values
      .slice(0, settings.pointCount)
      .map((value) => (item.values[baseline] === 0 ? null : (value / item.values[baseline]) * 100)),
  )
  const range = values.flat().filter((v): v is number => v !== null)
  const lower = Math.floor(Math.min(80, ...range) / 20) * 20
  const upper = Math.ceil(Math.max(120, ...range) / 20) * 20
  const x = (index: number) => 36 + (index / (settings.pointCount - 1)) * 444
  const y = (value: number) => 154 - ((value - lower) / (upper - lower)) * 136
  const date = (index: number) => `Jan ${index * 2 + 1}`
  const choose = (index: number, focus = false) => {
    if (!active) {
      return
    }
    setBaseline(index)
    if (focus) {
      buttons.current[index]?.focus()
    }
  }
  return (
    <section
      className="sf-normalized-baseline"
      aria-label="Compare audience growth"
      data-still={!active || keyboard}
      onKeyDownCapture={() => setKeyboard(true)}
      onPointerDownCapture={() => setKeyboard(false)}
      style={{ "--nb-duration": `${settings.pegSettleMs}ms` } as React.CSSProperties}
    >
      <div className="nb-chart">
        <header>
          <div>
            <strong>Audience growth</strong>
          </div>
          <div className="nb-base">
            <span>Baseline</span>
            <strong>
              {date(baseline)} <span>= 100</span>
            </strong>
          </div>
        </header>
        <div className="nb-plot">
          <svg
            viewBox="0 0 510 186"
            preserveAspectRatio="none"
            role="img"
            aria-label={`Channel growth indexed to 100 on ${date(baseline)}`}
          >
            {[lower, (lower + upper) / 2, upper].map((value) => (
              <g key={value}>
                <path d={`M36 ${y(value)}H480`} stroke="#e7e6dd" strokeDasharray="2 4" />
                <text x="25" y={y(value) + 3} textAnchor="end">
                  {value}
                </text>
              </g>
            ))}
            <path d={`M36 ${y(100)}H480`} stroke="#c9c9bc" />
            {series.map((item, i) => (
              <path
                key={item.name}
                d={values[i].map((value, j) => (value === null ? "" : `${j ? "L" : "M"}${x(j)},${y(value)}`)).join(" ")}
                fill="none"
                stroke={item.color}
                strokeWidth="2.3"
                strokeLinejoin="round"
                strokeLinecap="round"
              />
            ))}
            <g className="nb-peg" style={{ transform: `translateX(${x(baseline)}px)` }}>
              <path d="M0 10V158" stroke="#34372f" strokeDasharray="3 3" />
              <path d="m-4 5 4 5 4-5Z" fill="#34372f" />
            </g>
            <circle cx={x(baseline)} cy={y(100)} r="4.5" fill="#fff" stroke="#34372f" strokeWidth="2" />
            {Array.from({ length: settings.pointCount }, (_, i) => (
              <text key={i} x={x(i)} y="178" textAnchor="middle" fill={baseline === i ? "#34372f" : undefined}>
                {i === 0 ? "Jan 1" : i * 2 + 1}
              </text>
            ))}
          </svg>
          <div className="nb-targets" role="group" aria-label="Choose the comparison day">
            {Array.from({ length: settings.pointCount }, (_, i) => (
              <button
                type="button"
                key={i}
                ref={(node) => {
                  buttons.current[i] = node
                }}
                style={{ left: `${(x(i) / 510) * 100}%`, width: `${(444 / (settings.pointCount - 1) / 510) * 100}%` }}
                aria-label={`Use ${date(i)} as baseline`}
                aria-pressed={baseline === i}
                disabled={!active}
                tabIndex={baseline === i ? 0 : -1}
                onClick={() => choose(i)}
                onKeyDown={(event) => {
                  const next =
                    event.key === "ArrowRight"
                      ? Math.min(i + 1, settings.pointCount - 1)
                      : event.key === "ArrowLeft"
                      ? Math.max(i - 1, 0)
                      : event.key === "Home"
                      ? 0
                      : event.key === "End"
                      ? settings.pointCount - 1
                      : null
                  if (next !== null) {
                    event.preventDefault()
                    choose(next, true)
                  }
                }}
              />
            ))}
          </div>
        </div>
        <div className="nb-legend" style={{ gridTemplateColumns: `repeat(${series.length},1fr)` }}>
          {series.map((item, i) => (
            <div key={item.name}>
              <span className="nb-label">
                <i style={{ background: item.color }} />
                {item.name}
              </span>
              <strong>
                {values[i].at(-1)?.toFixed(1) ?? "Unavailable"}
                <span> index</span>
              </strong>
              {settings.showRawValues ? (
                <small>
                  {item.values[baseline].toLocaleString("en-US")} →{" "}
                  {item.values[settings.pointCount - 1].toLocaleString("en-US")} visits
                </small>
              ) : null}
            </div>
          ))}
        </div>
        <span className="nb-sr" aria-live="polite">
          Baseline {date(baseline)}.{" "}
          {series.map((s, i) => `${s.name}: ${values[i].at(-1)?.toFixed(1) ?? "unavailable"}`).join(". ")}
        </span>
      </div>
      <style>{`
.sf-normalized-baseline{width:100%;height:100%;min-height:260px;box-sizing:border-box;display:grid;place-items:center;padding:24px;background:#f1eee8;color:#34372f;font:12px/1.4 -apple-system,BlinkMacSystemFont,"Segoe UI",sans-serif;overflow:hidden;isolation:isolate}.sf-normalized-baseline *{box-sizing:border-box}.sf-normalized-baseline .nb-chart{width:100%;max-width:540px;background:#fff;border:1px solid #dddcd3;border-radius:13px;padding:18px 22px 16px;box-shadow:0 1px 3px #3c254608,0 12px 24px #3c254606}.sf-normalized-baseline header{display:flex;justify-content:space-between;align-items:center;gap:12px;margin-bottom:10px}.sf-normalized-baseline header strong{display:block;font-size:14px;font-weight:600;letter-spacing:-.2px}.sf-normalized-baseline header span{display:block;color:#8a8c81;font-size:10px;margin-top:2px}.sf-normalized-baseline .nb-base{text-align:right;flex:none}.sf-normalized-baseline .nb-base>span{font-size:9px}.sf-normalized-baseline .nb-base strong{font-size:11px;font-variant-numeric:tabular-nums}.sf-normalized-baseline .nb-base strong span{display:inline;font-size:10px;font-weight:400}.sf-normalized-baseline .nb-plot{position:relative;width:100%}.sf-normalized-baseline .nb-plot>svg{display:block;width:100%;height:154px;overflow:visible}.sf-normalized-baseline svg text{font:9px -apple-system,BlinkMacSystemFont,"Segoe UI",sans-serif;fill:#8a8c81;font-variant-numeric:tabular-nums}.sf-normalized-baseline .nb-peg{transition:transform var(--nb-duration) cubic-bezier(.22,1,.36,1)}.sf-normalized-baseline .nb-targets{position:absolute;inset:0}.sf-normalized-baseline .nb-targets button{position:absolute;top:0;bottom:0;transform:translateX(-50%);border:0;background:transparent;cursor:pointer;min-height:44px;touch-action:manipulation;border-radius:5px;padding:0}.sf-normalized-baseline .nb-targets button:disabled{cursor:default}.sf-normalized-baseline button:focus-visible{outline:2px solid #295fca;outline-offset:-2px;background:#295fca0a}.sf-normalized-baseline .nb-legend{display:grid;gap:14px;padding-top:13px;margin-top:8px;border-top:1px solid #ebeae1}.sf-normalized-baseline .nb-label{display:flex;align-items:center;gap:6px;font-size:10px;color:#73776c;white-space:nowrap}.sf-normalized-baseline .nb-label i{width:6px;height:6px;border-radius:50%;flex:none}.sf-normalized-baseline .nb-legend strong{display:block;font-size:18px;font-weight:500;letter-spacing:-.5px;font-variant-numeric:tabular-nums;margin-top:5px}.sf-normalized-baseline .nb-legend strong span{font-size:9px;font-weight:400;letter-spacing:0;color:#93968a}.sf-normalized-baseline .nb-legend small{display:block;font-size:9px;color:#93968a;margin-top:2px;white-space:nowrap;font-variant-numeric:tabular-nums}.sf-normalized-baseline .nb-sr{position:absolute;width:1px;height:1px;overflow:hidden;clip-path:inset(50%)}.sf-normalized-baseline[data-still=true] *{transition:none!important}@media(prefers-reduced-motion:reduce){.sf-normalized-baseline *{transition:none!important}}@media(max-width:430px){.sf-normalized-baseline{padding:14px}.sf-normalized-baseline .nb-chart{padding:17px 12px}.sf-normalized-baseline .nb-legend{gap:7px}.sf-normalized-baseline .nb-legend strong{font-size:15px}}
    `}</style>
    </section>
  )
}
export default function Example({ active = true, config }: { active?: boolean; config?: Partial<Config> }) {
  const settings = { ...DEFAULT_CONFIG, ...config }
  settings.seriesCount = Math.round(bound(settings.seriesCount, 2, 4))
  settings.pointCount = Math.round(bound(settings.pointCount, 5, 12))
  settings.pegSettleMs = bound(settings.pegSettleMs, 0, 240)
  return <Chart key={`${settings.seriesCount}:${settings.pointCount}`} active={active} settings={settings} />
}
Where it works well
Compare relative change across series with different raw scales.
Reduced motion
Series values update immediately. The baseline peg skips its 160 ms transition for keyboard input, reduced motion and inactive hosts.
Things to know
Four fixed, positive fictional traffic series. No live analytics, financial returns or statistical inference. Configuring series or observation counts resets the selected baseline.